
Grafana installation and configuration on Ubuntu server 18.04 LTS
Grafana is a webbased open source frontend for virtualizing metrics and for alerting when thresholds are exceeded. Grafana supports numerous data sources, for example Time Series databases such as InfluxDB, Graphite or Prometheus, log files via Elasticsearch and SQL data bases. Pre-defined dashboards are available through a marketplace.[1] This aticle explains the installation of Grafana in version 6.6.2 on Ubuntu 18.04 LTS as well as the connection of a InfluxDB database as a data source.

Installation
Grafana can be easily installed using Ubuntu's built-in package manager.[2] The following paragraphs show how to install Grafana on Ubuntu. Information about the installation on Windows, MAC and other Linux distributions can be found in the Grafana download area.[3]
Add package sources
Since Grafana is not included in the official package repositories, the Grafana repository can be added as follows:
tk@monitoringlesv2:~$ sudo apt install -y apt-transport-https
tk@monitoringlesv2:~$ sudo apt install -y software-properties-common wget
tk@monitoringlesv2:~$ wget -q -O - https://packages.grafana.com/gpg.key | sudo apt-key add -
tk@monitoringlesv2:~$ sudo add-apt-repository "deb https://packages.grafana.com/oss/deb stable main"
tk@monitoringlesv2:~$ sudo apt update
Install Grafana and activate Systemd daemon
After the package sources have been added, Grafana can be installed and the SystemD-service can be started and activated for Grafana:
tk@monitoringlesv2:~$ sudo apt install grafana
tk@monitoringlesv2:~$ sudo systemctl daemon-reload
tk@monitoringlesv2:~$ sudo systemctl enable grafana-server
tk@monitoringlesv2:~$ sudo systemctl start grafana-server
tk@monitoringlesv2:~$ sudo systemctl status grafana-server
Configure Grafana
The configuration is made via Grafana webinterface.[4] To proceed with the remaining configuration steps, launch a browser of your choice.
- Webinterface: http://<IP-des-Grafana-Servers>:3000
- Username: admin
- Password: admin
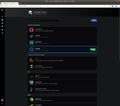
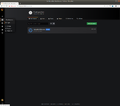
Login to webinterface
Log in with the username "admin" and the password "admin":
-
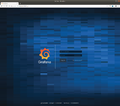 Grafana login
 -
 Log in to the web interface using the username "admin" and password "admin".
 -
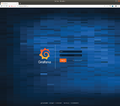
 A prompt to change your password appears.


Add datasource
This paragraph shows how to connect an InfluxDB as datasource to Grafana:
-
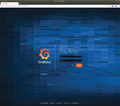
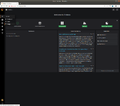
 After logging in to the web interface, you will see the following screen. Click on Add data source.
 -
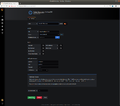
 Click Select in the InfluxDB row.
 -
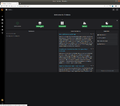
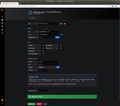
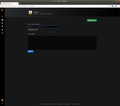
 Assign a name to the data source, specify the path to InfluxDB, and select the database you want to connect to. Click Save & Test.
 -
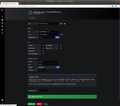
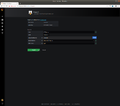
 If the message Data source is working appears, the connection from InfluxDB to Grafana was successful.
 -
 Click Back.


Import dashboard
Pre-defined Grafana dashboards can be easily imported:
-
 Switch to the menu option Dashboards → Home.
 -
 Go to Create → Import, to import a dashboard.
 -
 Search for a suitable dashboard on Grafana and enter the URL or dashboard ID here.
 -
 Depending on the dashboard, adjust a few more variables and then click Import.


References
- ↑ Grafana Dashboards (grafana.com)
- ↑ Install on Debian or Ubuntu (grafana.com)
- ↑ Download Grafana (grafana.com)
- ↑ Getting started (grafana.com)
 |
Author: Thomas Niedermeier Thomas Niedermeier working in the product management team at Thomas-Krenn, completed his bachelor's degree in business informatics at the Deggendorf University of Applied Sciences. Since 2013 Thomas is employed at Thomas-Krenn and takes care of OPNsense firewalls, the Thomas-Krenn-Wiki and firmware security updates.
|
 |
Translator: Alina Ranzinger Alina has been working at Thomas-Krenn.AG since 2024. After her training as multilingual business assistant, she got her job as assistant of the Product Management and is responsible for the translation of texts and for the organisation of the department.
|