

 wiki
wikiLinux Performance Analysis with collectd
collectd is a daemon that collects system statistics in structured form. The data is in rrd format and can be used for performance analysis and reporting of the resource consumption. For the visual representation of the collected collectd-data, there are multiple frontends, which are developed largely independently of collectd. In the following, it is explained how to install and configure collectd on Ubuntu 14.04 LTS. We will also take a look at front ends that generate graphs from the collectd rrd-data. Alternatively, Serverstats or Sar can also be used for similar analysis.
Installation
For the installation of the minimal collectd-daemon, it is recommended the option --no-install-recommends on Ubuntu. Otherwise, significantly more packages would be installed. For the general installation and configuration, the following packages are sufficient:
$ sudo apt-get install --no-install-recommends collectd
[...]
The following extra packages will be installed:
  collectd-core fontconfig fontconfig-config fonts-dejavu-core libcairo2
  libdatrie1 libdbi1 libfontconfig1 libgraphite2-3 libharfbuzz0b libltdl7
  libpango-1.0-0 libpangocairo-1.0-0 libpangoft2-1.0-0 libpixman-1-0 librrd4
  libthai-data libthai0 libxcb-render0 libxcb-shm0 libxrender1
Suggested packages:
  collectd-dev librrds-perl liburi-perl libhtml-parser-perl
  libregexp-common-perl libconfig-general-perl httpd-cgi apache2 apcupsd bind9
  hddtemp ipvsadm lm-sensors mbmon memcached mysql-server nginx
  notification-daemon nut openvpn olsrd pdns-server postgresql time-daemon
  ttf-baekmuk ttf-arphic-gbsn00lp ttf-arphic-bsmi00lp ttf-arphic-gkai00mp
  ttf-arphic-bkai00mp
Recommended packages:
  libesmtp6 liblvm2app2.2 libmemcached10 libmnl0 libmodbus5 libmysqlclient18
  libnotify4 libopenipmi0 liboping0 libperl5.18 libpq5 libprotobuf-c0
  librabbitmq1 libsensors4 libsnmp30 libtokyotyrant3 libupsclient3
  libvarnishapi1 libvirt0 libyajl2 default-jre-headless rrdtool ttf-dejavu
  ttf-bitstream-vera
The following NEW packages will be installed:
  collectd collectd-core fontconfig fontconfig-config fonts-dejavu-core
  libcairo2 libdatrie1 libdbi1 libfontconfig1 libgraphite2-3 libharfbuzz0b
  libltdl7 libpango-1.0-0 libpangocairo-1.0-0 libpangoft2-1.0-0 libpixman-1-0
  librrd4 libthai-data libthai0 libxcb-render0 libxcb-shm0 libxrender1
0 upgraded, 22 newly installed, 0 to remove and 0 not upgraded.
Need to get 3,649 kB of archives.
After this operation, 13.6 MB of additional disk space will be used.
[...]
Configuration
The main configuration file is located at /etc/collectd/collectd.conf. In this file, the so-called plugins control the monitoring and logging of the resource.[1] By default, several plugins are already active that monitor basic resources:
$ egrep '^LoadPlugin' /etc/collectd/collectd.conf
LoadPlugin syslog
LoadPlugin battery
LoadPlugin cpu
LoadPlugin df
LoadPlugin disk
LoadPlugin entropy
LoadPlugin interface
LoadPlugin irq
LoadPlugin load
LoadPlugin memory
LoadPlugin processes
LoadPlugin rrdtool
LoadPlugin swap
LoadPlugin users
Detailed configuration options are specified in the plugin's XML sections. In the following example, the hard drive to be monitored is:
$ sudo vi /etc/collectd/collectd.conf
<Plugin disk>
        Disk "sdb"
        IgnoreSelected false
</Plugin>
After changing the configuration file, collectd must be restarted:
$ sudo service collectd restart
rrd data
The generated statistics are located in the /var/lib/collectd/rrd directory. These can be analyzed directly on the host for further analysis or copied to another system. The following paragraph describes how graphs are created from the data.
Generate Graphs from rrd data
To create graphs from the rrd data, some libraries are required for the processing of the rrd data[2]
$ sudo apt-get install librrds-perl libconfig-general-perl libhtml-parser-perl libregexp-common-perl libjson-perl
collectd-web
An easy and good way to get graph paper is collectd-web.[3][4]
$ git clone git://github.com/httpdss/collectd-web.git
Cloning into 'collectd-web'...
$ sudo cp -a collectd-web/ /var/www/html/
$ sudo vi /etc/apache2/sites-available/collectd-web.conf
<Directory /var/www/html/collectd-web>
        Options Indexes FollowSymLinks MultiViews
        AllowOverride all
        Order allow,deny
        allow from all
</Directory>
$ sudo a2ensite collectd-web
For Apache, the following settings are required:
$ sudo a2enmod cgi
After activating the web-configuration for collectd-web, the graphs of the rrd-data is accessible via browser:
-
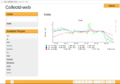 collectd performance data on load.
 -
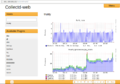 collectd performance data on processes and forks.
 -
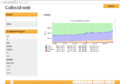 collectd performance data on memory.
 -
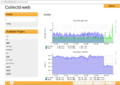 collectd performance data on disk.


References
- ↑ Table of Plugins (collectd.org)
- ↑ collectd collectd First Steps (collectd.org)
- ↑ collectd Frontend collectd-web (collectd.org)
- ↑ collectd Website (collectdweb.appspot.com)
Author: Georg Schönberger
 |
Translator: Alina Ranzinger Alina has been working at Thomas-Krenn.AG since 2024. After her training as multilingual business assistant, she got her job as assistant of the Product Management and is responsible for the translation of texts and for the organisation of the department.
|