
InfluxDB2 + Grafana Configuration of a metric server for Proxmox VE
This article explains how to configure InfluxDB and Grafana to send data from your Proxmox VE system to InfluxDB and visualize it appealingly via Grafana. This article covers creating an API token in InfluxDB2, configuring a datasource in Grafana, and setting up Proxmox VE. Finally, a dashboard is imported, and data from the Proxmox VE system is visualized.
InfluxDB2 API Access Creation
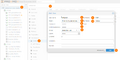
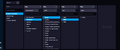
Create an API token via the InfluxDB2 Web UI so that Proxmox VE can send data to InfluxDB:
-
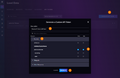 Influx DB API Token

Make sure to copy your API token, as it cannot be viewed again! **Note:** The Copy to Clipboard button did not work for me; manually copy the API token and verify the clipboard contents.
Grafana Configuration for InfluxDB2 Source
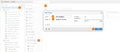
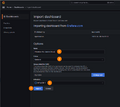
To allow Grafana to fetch data from InfluxDB, it must be added as a source in Grafana. Go to http://YOURIP:8007/connections/datasources/influxdb or Home / Connections / Add new connection / InfluxDB and fill out the following after clicking Add new data source:
-
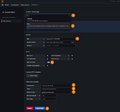 Source configuration for your bucket

If successful, you should see the following confirmation message:

Proxmox VE Configuration
Next, you need to configure Proxmox VE to send data to InfluxDB2. To do this, go to Datacenter -> Permissions -> Groups and first create a group with the "pveauditor" permission. Then proceed to grant permissions to the group, create a user with group membership, generate an API token, and finally link Proxmox VE to the metric server (InfluxDB2).
-
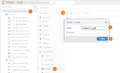 Create PVE group
 -
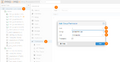 Define PVE group permissions (PVE-Auditor)
 -
 Create a PVE user with group membership
 -
 Create Proxmox API token
 -
 Proxmox API token
 -
 Proxmox VE Metric Server configuration


Validation
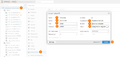
To check if it worked, go to the InfluxDB2 UI and look at the bucket to verify if it has received data:

Setting Up Proxmox VE Cluster Dashboard
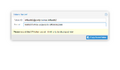
In Grafana, you can now import a pre-configured dashboard. Log in, go to the "Dashboard / New" section, and import a new dashboard. Use the Dashboard from the Grafana Hub. It has the ID: 19119, which can be entered during the import process.
-
 InfluxDB2 Data Explorer
 -
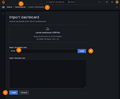 Grafana Proxmox VE Cluster Dashboard Import
 -
 Grafana Proxmox VE Cluster Dashboard Import
 -
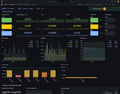 Proxmox VE Cluster Dashboard


 |
Translator: Alina Ranzinger Alina has been working at Thomas-Krenn.AG since 2024. After her training as multilingual business assistant, she got her job as assistant of the Product Management and is responsible for the translation of texts and for the organisation of the department.
|
 |
Author: Jonas Sterr Jonas Sterr has been working for Thomas-Krenn for several years. Originally employed as a trainee in technical support and then in hosting (formerly Filoo), Mr. Sterr now mainly deals with the topics of storage (SDS / Huawei / Netapp), virtualization (VMware, Proxmox, HyperV) and network (switches, firewalls) in product management at Thomas-Krenn.AG in Freyung.
|