
Setup the IPMI remote management interface
This article describes the initial setup of a IPMI Remote Management Interface. How do I use the IPMI console successfully and what features does it offer? Answers to these and other questions can be found in this article using the IPMI interface of a Supermicro X10DRi motherboard.
IPMI Basics
The interface of the IPMI interface usually has a dedicated NIC port, which is located above the USB ports on Supermicro motherboards. The IPMI (Intelligent Platform Management Interface) is a management interface that allows the remote management of the server. It provides various options for administration and configuration.
The article IPMI Basics contains further information about the components, the structure and the communication interfaces of an IPMI interface.
Start up
The following screenshots show how to start up the IPMI Remote Management Interface of your server.
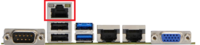
To activate the IPMI console, it must be equipped with a LAN cable. The IPMI console is located above the USB ports, as shown in the following figure.
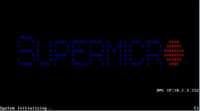
The server can then be booted. The POST should already show that the IPMI initializes itself and refers to an IP address. At this point, press the Delete key repeatedly to enter the BIOS.
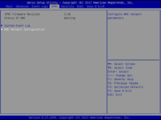
Now switch to the IPMI tab and then to the BMC Network Configuration menu.
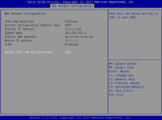
Here you will see the IP address with which the IPMI interface can be reached. If there is no DHCP server in the network, the IP address has to be assigned static. Now restart the server.
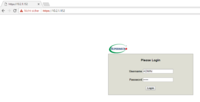
Then type the IP address in the address bar of the browser and then log in with the user ADMIN and password ADMIN.


Overview of the most important functions
The following screenshots show an overview of the most important functions of an IPMI interface.
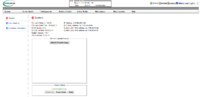
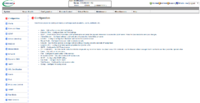
System: Here you will find an overview of all important information: Firmware Version, MAC address, IP address etc. Under Remote Console Preview you can set up a remote connection. Simply click on the window. You can also use IPMI to switch the server on, restart or shut down.
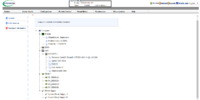
Hardware Information: You will find an overview of the installed hardware in the menu Hardware Information.
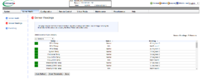
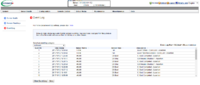
In the category Server Health you will find the item Sensor Readings. All sensor values with status output and temperature displays are displayed there. The sensors can be categorized as desired. To do this, click on the drop-down menu All Sensors.
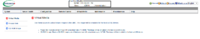
Event Log: That's where all the events are logged. For example, a server reboot or problems with hardware components are logged here.
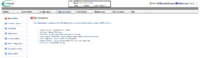
Configuration: Here you can set up all important settings or configurations, for example Network settings, Email notification and Fan settings.
Virtual Media: At this point you can include a virtual medium, for example a CD.
Maintenance: In this menu you can maintain and manage the IPMI Remote Management Interface. For example, perform a Firmware Update, check the System Event Logs, etc.


 |
Author: Theresa Lorenz Theresa Lorenz has been with Thomas-Krenn.AG since 2013. After completing her training as an IT specialist, she assisted customers with support requests. With the experience she gained, she then switched to production and created assembly instructions and documentation for production and quality assurance processes. She is now team leader of the entire assembly team in our production department. In her free time, she enjoys sports and cultivating her friendships.
|